Tie Goes to the Runner
Relative strength wins under daily liquidity pressures
Welcome to +32 new subscribers over the last 30 days.
If you are looking for unique investment ideas backed by interesting research, you have come to the right place.
I highly encourage newcomers to go back and read through our past 100+ newsletters since we launched Tuttle Ventures.
Packed with:
Our Most Popular Macro Views: Bonds Never Lie, Our Landmark Inflation Call
Investment Positioning: Investing Playbook, My Go to resource for ideas
Private Investments: SpaceX, Socket Security, Midtown National Group (MNG)
All available — in the archive for our subscribers.
In “Tie Goes to the Runner” I highlight the competing forces at play in the market (Flat leading economic growth and loose financial conditions).
Without a clear directional signal, we believe daily liquidity becomes the most important factor driving markets.
As long as the reverse repo levels are unrestrictive, we believe investors will continue boosting small recent secular winners, stretching successful themes with short term relative strength. (Energy, Health Care, Financials)
At the same time, we see the broader headline market indices to continue to weaken as we wait for a new market catalyst.
Newsletter rundown:
Leading Economic Growth is Flat
Financial Conditions are Loose
It all comes down to daily cash
Leading Economic Growth is Flat
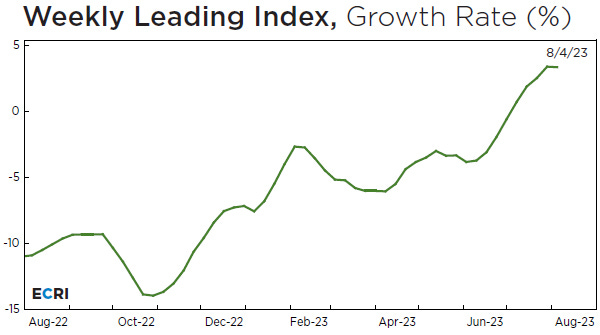
The Economic Cycle Research Institute (ECRI) maintains a proprietary composite of leading economic indicators. It has an impressive record, going back decades, of signaling recessions and busines cycle changes.
Today’s update shows ECRI's U.S. Weekly Leading Index growth rate is flat.
I see the latest flat rate as a sign of uncertainty in the economy. It could mean that the leading indicators used by ECRI are giving mixed signals. Some might be pointing towards growth, while others could be signaling contraction, resulting in an overall neutral or flat growth rate.
Financial Conditions are still Loose
The Adjusted National Financial Conditions Index (ANFCI) is a comprehensive weekly update on U.S. financial conditions in money markets, debt and equity markets, including “shadow” banking systems.
It continues to show the lack of direct control that the Fed policy has had in being restrictive.
Chairman Jerome Powell isn’t a fan of this measure. In his own words, “So, financial conditions seem to have tightened and probably by more than the traditional indexes say. Because the traditional indexes are focused a lot on rates and equities. And they don't necessarily capture lending conditions"
While it’s true rates and equities play a big part, the index does capture lending conditions by surveying bank managers.
Powell just doesn’t like things outside of his control.
I like using this as a measure because the index isolates components of financial conditions uncorrelated with economic conditions to provide a useful update.
The index is designed to have an average value of 0 and a standard deviation of 1 over a sample period extending back to 1971.
Positive values of the ANFCI have been historically associated with tighter-than-average financial conditions. (Bad for stocks)
Negative values have been historically associated with looser-than-average financial conditions. (Good for stocks)
In the chart people you can see the last few months there was clearly some easing of financial conditions plus slowing inflation supporting real incomes.
This is important because the Fed’s manipulation of short-term interest rates doesn’t shape the economy all by itself.
The markets’ reaction through financial conditions related to Fed policy is just as important.
It all comes down to daily cash
Without a clear directional signal, we believe daily liquidity becomes the most important factor driving markets.
When your future is unknown, human nature is wired to emphasize trades with the quickest payoff and the fastest time to resolution.
In psychology the concept is called "temporal discounting" or "delay discounting."
This refers to the tendency of people to prefer smaller, more immediate rewards over larger, delayed rewards. In other words, the value of a reward is perceived as being less the further in the future it will be received.
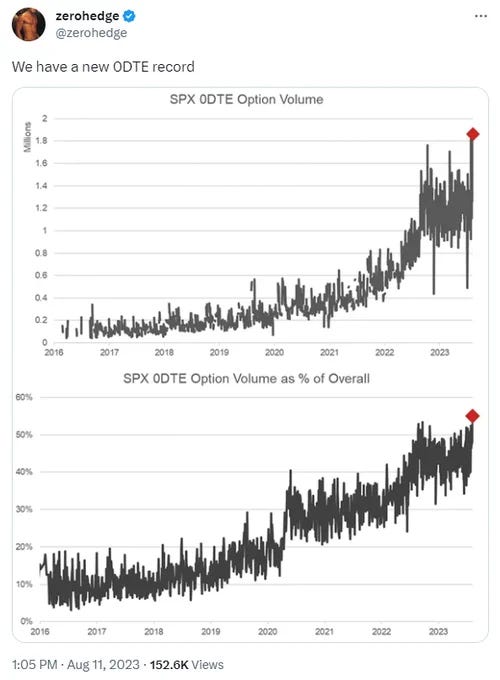
We can clearly see this evident with the new highs in 0 DTE option trading. (Zero Days to Expiration)
We believe the phenomenon of zero days to expiration in the options market is simply a reaction to the broader issue of daily liquidity.
The most money is being made by short term option traders drunk on excess daily liquidity.
The easiest way to understand how much liquidity is in the market is based on the overnight reverse repo level.
The higher the repo level, the lower the amount of liquidity in the market.
This is a follow up to the attention that I gave to the repo market back in July…
Since July, I have fine tuned my analysis, and I encourage readers to go back and reread The Repo Market Revealed.
The biggest takeaway is that a reduction in the overnight reverse repo level shifts pools of money held within the financial plumbing system which encourages greater risk taking from large financial institutions.
The Fed has to maintain the shell game of irresponsible money printing from the Covid crisis.
(Keep in mind we understand that repo levels are not a direct one for one relationship with market liquidity. There are many factors at play including the TGA balance, treasury issuance, domestic risk appetite, and foreign buyers of treasuries).
All that being said, the bank term funding program combined with declining trending inflation flipped liquidity models to make the reverse repo the largest catalyst for liquidity.
Based on our review, what is “left in the repo tank” is the clearest signal to what daily liquidity is and in turn the daily close of the S&P 500 index.
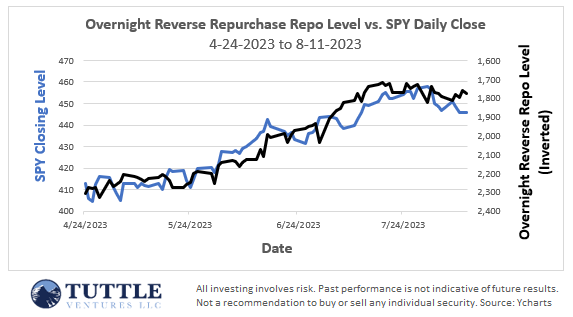
Our latest update shows the strong relationship that overnight repo level has had compared to the SPY 0.00%↑ daily close.
You can see the black and blue lines almost move in lockstep.
While some argue that this is definitely a short period, (only a few months) the liquidity model had to be updated after the bank term funding program in March.
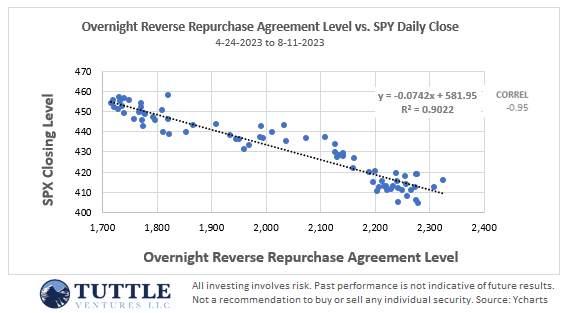
In practical terms, RRP and SPY Daily Close have had a very strong negative relationship at a statistically significant level α=0.05.
Just because the relationship is strong, doesn’t mean we can predict the markets.
Predicting how many dollars will be released in the reverse repo is just as difficult as trying to predict other market indicators.
The beauty is that the Fed controls the overnight reverse repo and can be altered daily.
This is a level of control held by the Fed which has not been seen for decades.
With the umpire being the primary focus of the game, I believe this creates the perfect set up for speculators to push current trends because the moral hazard falls upon the Fed.
In other words, speculators may look to push the envelope on whatever is recently working well because if it fails they can place the blame on the Fed.
The easiest way to screen for recent winners is to look at technical indicators such as the 14-Day Relative Strength Index.
The RSI oscillates between zero and 100. Traditionally the RSI is considered overbought when above 70 and oversold when below 30. Signals can be generated by looking for divergences and failure swings. RSI can also be used to identify the general trend.
Based on the table above, the biggest recent winners are in energy, health care and financials.
We will be looking at those sectors over the week along with the reverse repo levels.
While we do not trade individual sectors, we view opportunities for individual stocks in the short term within these sectors as having more potential upside pushing the runners to higher highs.
Final Word
We're grateful for the opportunity to learn, grow, and invest alongside you at Tuttle Ventures.
Like what I have to say? Let’s discuss your individual investment portfolio by scheduling a time below:

Book a meeting with Darin Tuttle
Best regards,
This is not investment advice. Do your own due diligence. I make no representation, warranty or undertaking, express or implied, as to the accuracy, reliability, completeness, or reasonableness of the information contained in this report. Any assumptions, opinions and estimates expressed in this report constitute my judgment as of the date thereof and is subject to change without notice. Any projections contained in the report are based on a number of assumptions as to market conditions. There is no guarantee that projected outcomes will be achieved.
Neither the publisher nor any of its affiliates accepts any liability whatsoever for any direct or consequential loss howsoever arising, directly or indirectly, from any use of the information contained herein.
Unless there is a signed Investment Management or Financial Planning Agreement by both parties, Tuttle Ventures is not acting as your financial advisor or in any fiduciary capacity.


