Research Projects Update
A brief summary of the research projects from Darin's Desk
There are 3 primary research projects we are working on at Tuttle Ventures.
VIX-Yield Curve Cycles Within Regime Changes with Anne Lungaard Hansen at the Richmond Federal Reserve and Brandon La Bella at UC Riverside
Geopolitical Risk GEOVOL with NYU V-Labs and Nobel Prize Winner Dr. Robert Engle
Net Liquidity Ratio in relation to the Adjusted National Financial Conditions Index
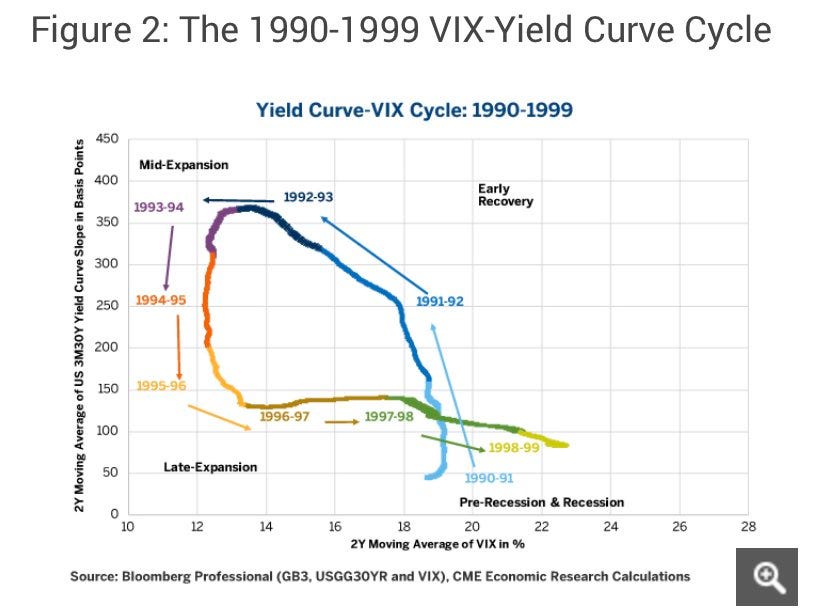
VIX-Yield Curve Cycles Within Regime Changes
Back in February of 2018, Erik Norland wrote about the VIX-Yield Curve Cycle in a paper titled: VIX-Yield Curve: At the Door of High Volatility?
The paper included a series of charts.
The charts were a watershed moment for me.
The comparison is made between the 2-year moving average of the 30yr-3m Treasury Spread vs. 2-year moving average of the VIX.
Erik’s paper was published from the academic work of Anne Lungaard Hansen: Predicting Recessions Using VIX-Yield Curve Cycles. Anne currently works at the Richmond Federal Reserve.
I believe the paper is significant for three reasons.
The VIX-Yield Curve Cycles (VYCCs) significantly outperforms the yield curve spread in predicting U.S. recessions from 1950-2022 both in- and out-of-sample and using both static and dynamic probit models.
VIX-yield curve cycles contain predictive power above and beyond other leading economic indicators.
There is not much published research currently related to Anne’s paper.
Anne has been helpful in our paper offering insights and data for which we are greatful.
In our paper, VIX-Yield Curve Cycles Within Regime Changes we attempt to define the VIX-Yield Curve Cycle (VYCC) across various economic stages. And suggest other statistical models outside of the probit model to replicate the VIX-Yield Curve Cycles (VYCCs).
We believe either a path dependency or hysteresis loop model will provide further meaningful insight.
It’s our hope to publish our research to the CFA Enterprising investor publication.
GEOVOL Risk
Geopolitical risk has become an increasingly important component of risk analysis.
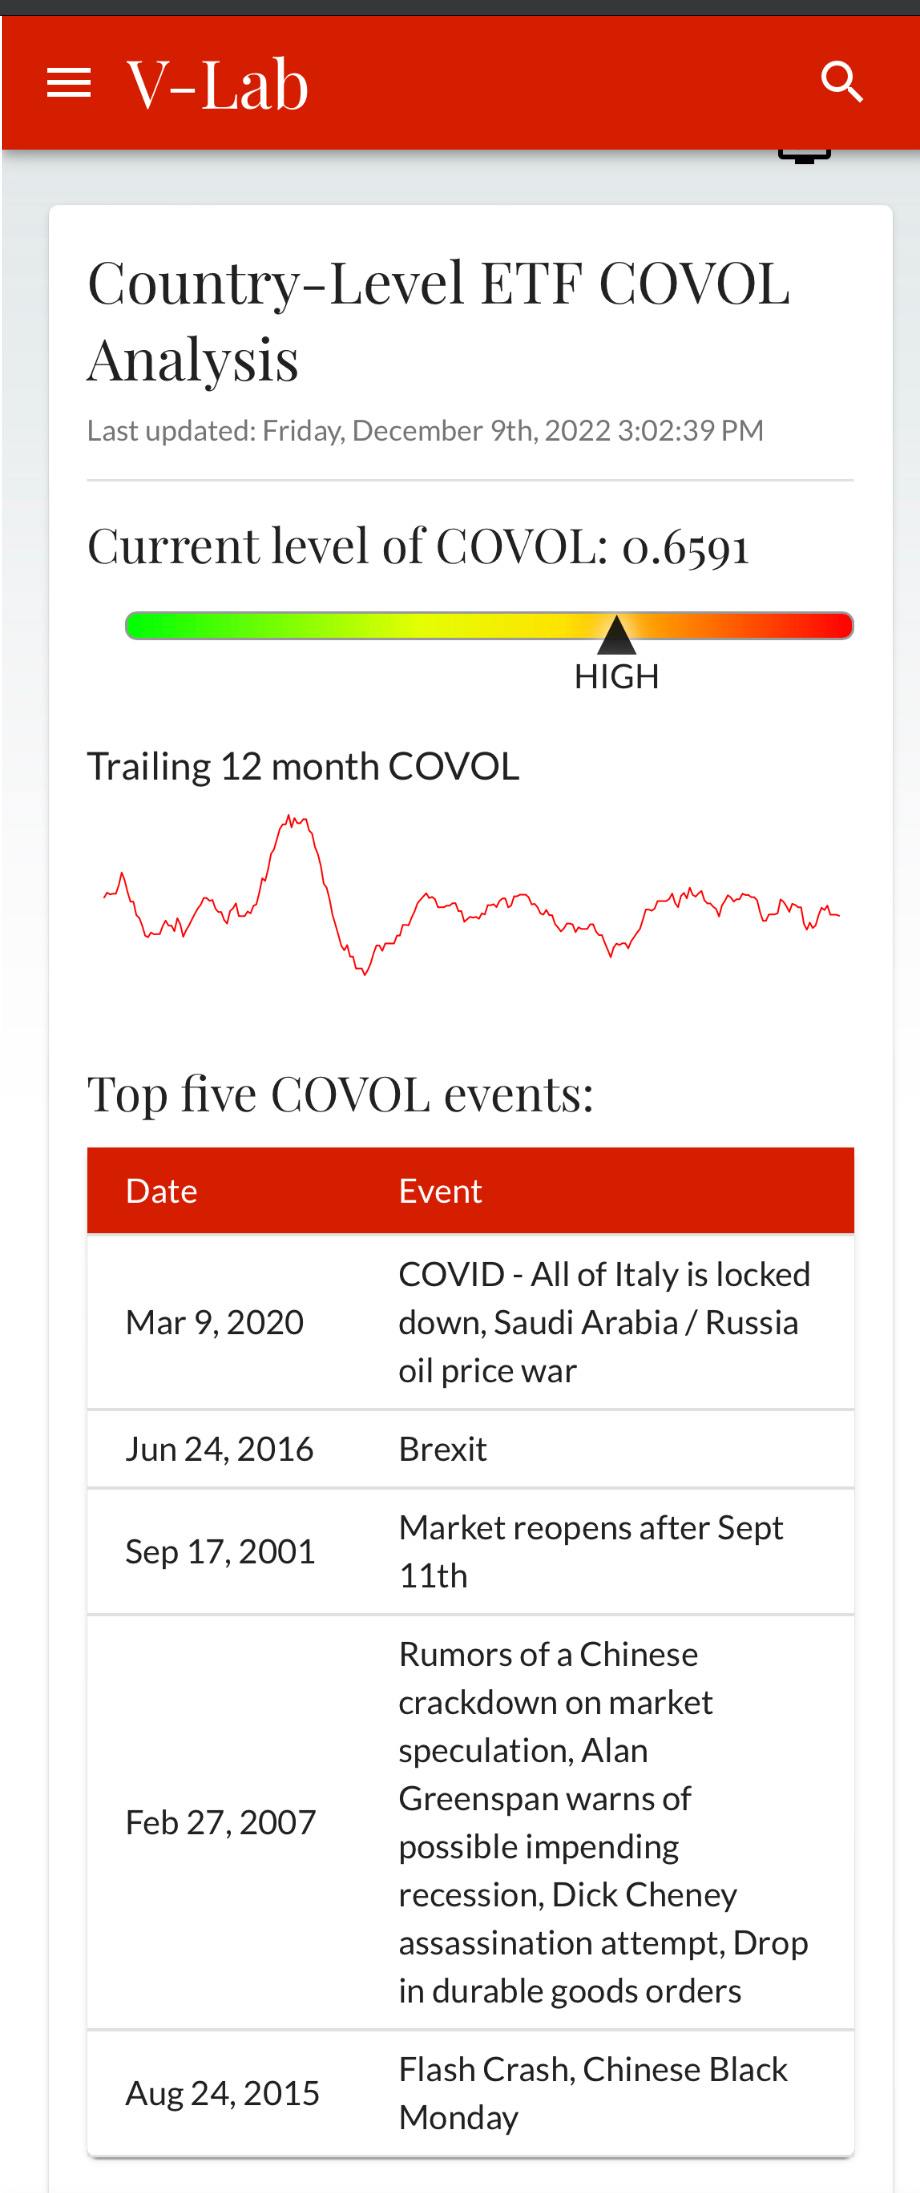
Our second research project is based on Dr. Robert Engle’s work from V-Labs at NYU.
Engle has done impressive work to define a common volatility metric based on the squared standard error residual previously unexplained in a GARCH factor model.
The correlations of the squared standard errors are set against parameters and tested for significance.
The magnitude and impact of various event shocks are calibrated.
This is then compared against country specific ETFs & asset classes returns. A factor weighted loading is rendered to the trailing standard deviation of the idiosyncratic risk to account for the magnitude of the shock.
What is interesting is that despite volatility shocks that affect all portfolios, some assets are more sensitive to the volatility shocks than others.
If a portfolio manager could isolate and/or underweight the more sensitive asset classes or single country ETFs to the volatility shocks—theoretically there could be alpha on a risk-adjusted basis.
As geopolitics has recently come under enhanced public eye, NYU V-labs website quietly changed the name of the model to “Common Volatility” instead of Geopolitical Volatility.
I was worried, so I asked Robert about this change on the website and this was his response:
Ignoring the politically correct referred I am looking forward to the daily output.
I am excited about the prospect of incorporating this metric for future optimization in an investment portfolio.
Whether this index can directly be attributed to Geopolitical risk is a topic worthy of debate.
Net Liquidity Ratio in relation to the Adjusted National Financial Conditions Index
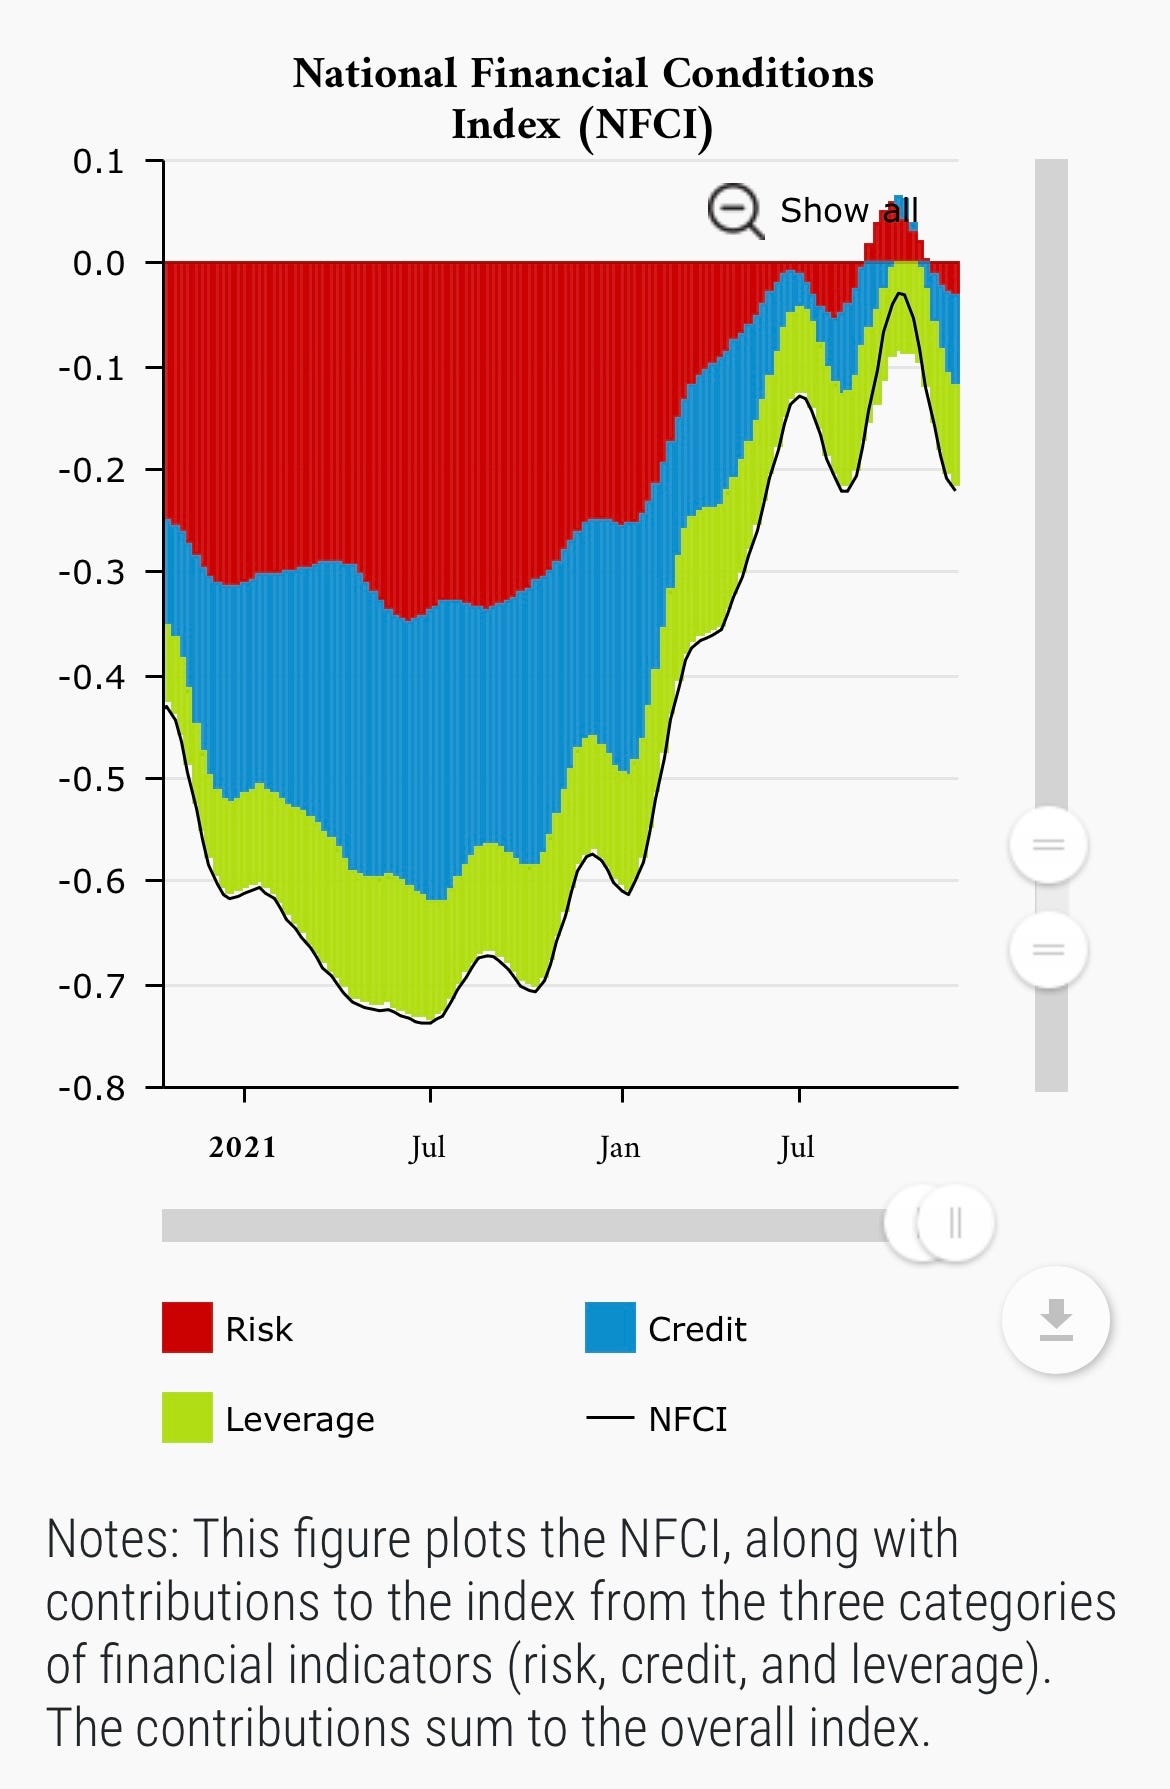
Frequent readers should know how much I like using the Chicago Fed’s National Financial Conditions index.
The weekly data goes back to the 1970’s, includes “shadow banking” metrics and is a key input in our investment outlook.
Just look at those looser than average conditions at 85/105.
This backdoor liquidity has so far held up equities prices. (The S&P 500 index level is also a weighted metric in the index)
New updates to the website has been productive.
The 105 indicators are summarized in a new table and revisions are clearly presented over time.
Our research considers the Net Liquidity Ratio in relation to the ANFCI.
Remember, the Net Liquidity Ratio is equal to: Fed Balance sheet - (Treasury General Account - sales of the reverse repo market*).
*FYI a subtraction of a sale is an increase*
A positive number is increasing liquidity a negative number is decreasing liquidity.
We are now tracking this on our website here.
What we are seeing is that the broader Net Liquidity Ratio has been a good barometer for when risk assets can or cannot handle QT.
It’s the right rope the Fed must walk.
When the ANFCI is tightening and there is decreasing net liquidity— it is negative for risk assets with a 1-2 week lag.
We visually plot this in the graph below.
(highlighted in yellow in the upper left quadrant)
The conditions for tightening and draining liquidity have also been historically rare— however, we are seeing an increase in the frequency these yellow “flare ups” occur this year.
Since we started tracking in 2018, 3 out of the 7 instances have happened since 9/14/22 and at the current pace, it’s likely we may see 1 or 2 more in December.
On average the top left quadrant 1 forecasts around -3% selloff in the S&P 500 two weeks later.
We will continue to test out this theory and see if it continues to have any significance in the markets.
It’s our hope to publish this to the CFA Enterprising investor publication.
Best,
Darin Tuttle, CFA
This is not investment advice. Do your own due diligence. I make no representation, warranty or undertaking, express or implied, as to the accuracy, reliability, completeness, or reasonableness of the information contained in this report. Any assumptions, opinions and estimates expressed in this report constitute my judgment as of the date thereof and is subject to change without notice. Any projections contained in the report are based on a number of assumptions as to market conditions. There is no guarantee that projected outcomes will be achieved.
Neither the publisher nor any of its affiliates accepts any liability whatsoever for any direct or consequential loss howsoever arising, directly or indirectly, from any use of the information contained herein.
Unless there is a signed Investment Management or Financial Planning Agreement by both parties, Tuttle Ventures is not acting as your financial advisor or in any fiduciary capacity.


