Is there anything that could slow down the Nvidia momentum?
New all-time highs. New products at CES.
New all-time highs. New products at CES. Is there anything that could slow down the Nvidia momentum? “This stock is a beast of its own.”
This morning I was on Schwab Network to talk $NVDA valuations and the chipmaker’s role in the A.I. movement.
Here are some of my show notes:
NVDA 0.00%↑ - Bullish $600 price target, BofA price target of $700, Truist $691
If you don’t already subscribe to Fabricated Knowledge I recommend his technical expertise related to this topic.
The semiconductor industry is the tollroad of innovation. Despite elevated valuations, we remain open to investment in select companies. We find value in the distinction between asset-intensive and asset-light business models given current valuations and the industry cycle.
While some valuations are stretched, we are bullish on NVDA 0.00%↑ with a $600 12-month price target. Key risks include geopolitical uncertainty, changes in business model, and a broad macroeconomic slowdown.
Key Points
Asset-light companies, like the business models of ASML, NVDA, LRCX, and AMD, historically outperform asset-intensive ones, suggesting a preferable investment focus.
The CHIPS Act's long-term effects on stock prices and earnings for asset-intensive investments remain uncertain but are a positive tailwind.
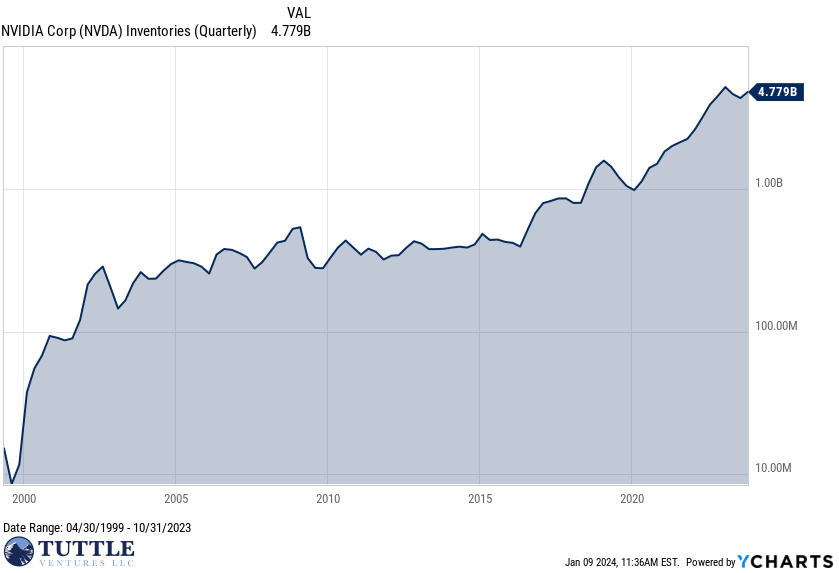
Variances in pricing are largely due to the emerging technology and uncertain demand for current inventory levels.
Companies are increasingly adopting effective inventory strategies to navigate market disruptions.
Asset-intensive vs. Asset-light
Not all target companies have the same business model. According to a study performed by EY, Fortune 500 public companies across sectors showed that asset-light companies achieved greater total shareholder returns compared to their asset-heavy peers, outperforming them by an average of four percentage points in the last five years. Source.
We decided to differentiate the business models between “Asset-intensive” and “Asset-light” based on capital expenditure to revenues reflecting the costs to maintain and operate assets over time.
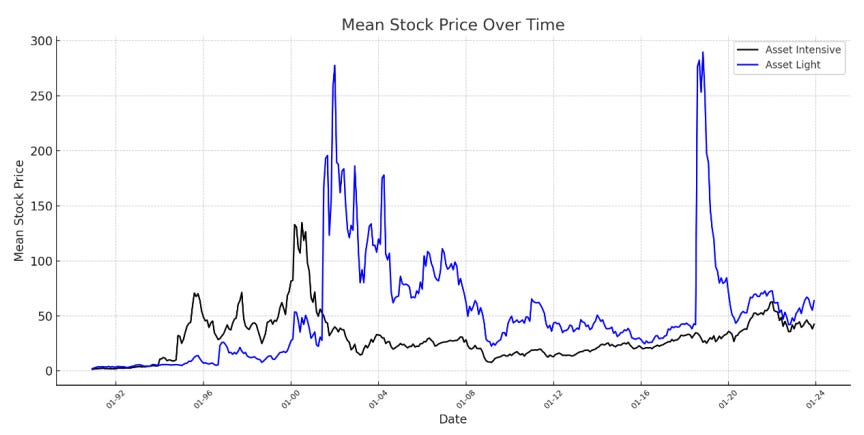
Historically, asset-light companies have shown to outperform significantly in the semiconductor space since the mid 2000’s.
● Asset-intensive Companies: CAPEX to Revenue ratio above 8%, includes chip manufacturing capabilities.
● Asset-light Companies: CAPEX to Revenue ratio below 8%. For example, ASML outsources the manufacturing of most of its parts, acting like an assembler.
Prior to the dot com bubble burst, asset-intensive outperformed asset-light. In the downturn, we believe CEOs learned the hard way how to effectively allocate capital. From our in-sample look back period since 1990, asset-light business models have significantly outperformed since. Today, companies of all types and sizes are using asset-light strategies to deal with massive market disruption and drive continued growth.
The signal is noisy. The rolling correlation of these two segments fluctuates over time, which indicates that the relationship between the stock prices between the two groups is positive but not constant. We note the sharp contrasts in correlation prior to and following stock market corrections. Current levels suggest some of the highest levels and we believe could mean revert back to the long term average of 0.5, providing a window for relative outperformance.
Sell In Vs. Sell Through
Here is a broad outline between the sub-segments:
The terms "sell in" and "sell through" refer to different stages in the distribution channel of semiconductor inventory.
"Sell in" represents when the manufacturer sells the product to the distributor or retailer
"Sell through" refers to the point at which the end consumer purchases the product.
In other words, "sell in" is the initial sale to the channel partner, while "sell through" represents the final sale to the end user. Understanding these terms is critical for semiconductor companies to manage their inventory levels effectively. The distinction helps management evaluate their distribution channels' performance and identify potential issues such as overstocking or understocking.
We can interpret this by analyzing the trends in inventory levels more directly with asset-light companies as they typically sell to end users. For example, a high "sell-in" volume without a corresponding "sell-through" could signal a problem with the product's marketability. In contrast, a low "sell-in" volume with a high "sell-through" could suggest a supply chain bottleneck that needs to be addressed.
Right now, we are in the cycle of high inventories at the distributors and retailers, so semiconductor companies are pulling back to focus on clearing the inventory and thus stopping further pricing pressure.
If we isolate for asset utilization trends over time, you can breakdown NVDA 0.00%↑ in three key areas: Days Sales Outstanding, Days Inventory Outstanding, and Days Payable Outstanding.
Overall the “winners” of inventory management in this cycle, I have to say hats off to NVIDIA as it stands out as being particularly effective within the asset-light companies.
Days Sales Outstanding (DSO) is a measure of the average number of days that a company takes to collect revenue after a sale has been made.
A low DSO value indicates that a company is able to quickly collect its receivables, which can improve cash flow and reduce the risk of bad debts. In the industry, the average DSO is 50. In the chart, NVIDIA has the lowest DSO at 38.71 days, which is below the industry average and relative to its asset-light peers. NVIDIA is in a strong incoming cash position.
This efficient collection of sales revenue allows NVIDIA more flexibility to reinvest in its business, cover short-term obligations, and reduce the need for external financing. All positives. It is also indicative of strong customer relationships and effective credit and collections policies.
The average industry Days Inventory Outstanding (DIO) is 123. NVIDIA has the lowest DIO at 87.94 days, which is favorable compared to its peers. This suggests NVIDIA has an efficient inventory management system, can quickly turn over its stock, and is responsive to market demands. Efficient inventory management can lead to better cash flow management and potentially lower costs due to reduced overstock and storage needs.
Days Payable Outstanding (DPO) is a turnover ratio that represents the average number of days it takes for a company to pay its suppliers.
A high DPO indicates that a company is paying its suppliers slower. A DPO of 17 means that on average, it takes the company 17 days to pays its suppliers. The industry average days payable outstanding is 40 with NVIDIA below at 37.95. NVIDIA is clearly the leader in inventory management which is key to survive in a cyclical industry.
CHIPS Act's Allocation and Geopolitical Impacts
The CHIPS and Science Act of 2022, which allocates $52.7 billion in federal subsidies for chip manufacturing, comes in response to severe supply chain disruptions. This act represents a shift in U.S. policy, aiming to bolster competitiveness in the semiconductor industry, which has seen a decline from 40% of global manufacturing capacity in 1990 to 12% today.
According to the latest report, of the CHIPS funding, about $39 billion over the next five years is earmarked for the construction of semiconductor fabrication plants. Source.
These subsidies are expected to cushion all semiconductor companies, enabling them to close talent gaps, upskill, and diversify their workforce.
It’s my opinion that CEO Jen-Hsun "Jensen" Huang is the best avenue for China investment into the US chips market.
The funding comes with geographical restrictions, prohibiting recipients from expanding semiconductor manufacturing in China or countries posing a threat to U.S. national security. This can be broadly interpreted, and I think poses geopolitical risk to companies with potential strong ties to mainline China. While government subsidies will make progress, we believe the AI armsrace may inflate costs. This might necessitate a reassessment of global strategies and careful planning for companies to determine AI capital allocation.
Which target companies have the potential outperform?
To understand which target companies have the potential to outperform, we must first define the benchmarked segment.
We chose the iShares Semiconductor ETF SOXX 0.00%↑ as a benchmark. The Exchange Traded Fund (ETF) SOXX is liquid, listed on US exchanges, tight intraday Bid/Ask spreads, traded options, and with 833,060 30-Day Average Daily Volume (ADV) and $9.3B in Assets Under Management (AUM) as of November 2023.
With an average of 35 semiconductor names held in the ETF, the fund has a high enough concentration to have meaningfully exposure to the sector and positive diversification properties within the industry.
Valuation
To justify a price target of $600 for NVDA, we need to consider several valuation techniques that align with the companies' asset-light business models and their position within the semiconductor industry, which we believe is long term is favorable.
Given NVIDIA's strong inventory and cash flow management, as evidenced by its low DSO and DIO, its earnings quality is high.
If EPS on an operating basis comes in line expectations a 45x multiple places is in line with the 3 year average.
By applying a premium P/E multiple that reflects NVIDIA's efficiency and market position relative to its historical average and peers, we can arrive at an increased valuation.
We would account for the expected growth in earnings due to the robust demand for NVIDIA's products in various sectors, including gaming, data centers, and artificial intelligence.
Best,
Darin Tuttle, CFA
This is not investment advice. Do your own due diligence. I make no representation, warranty or undertaking, express or implied, as to the accuracy, reliability, completeness, or reasonableness of the information contained in this report. Any assumptions, opinions and estimates expressed in this report constitute my judgment as of the date thereof and is subject to change without notice. Any projections contained in the report are based on a number of assumptions as to market conditions. There is no guarantee that projected outcomes will be achieved.
Neither the publisher nor any of its affiliates accepts any liability whatsoever for any direct or consequential loss howsoever arising, directly or indirectly, from any use of the information contained herein.
Unless there is a signed Investment Management or Financial Planning Agreement by both parties, Tuttle Ventures is not acting as your financial advisor or in any fiduciary capacity.


